Yield is a measure of the return an investor derives from a financial instrument. Typically, an investment yield is stated as an annual percentage rate of return. Many factors can influence the pricing and, ultimately, the yield of an investment. These factors include default, liquidity, and price risk; the general shape of the yield curve; and the tax status of the investment. The concept of yield curves and the impact of an investment’s tax status are described below.
- Yield Curves
- Tax Status16
A yield curve is a plot of the yields to maturity on the same investment instrument or class of instruments, but with varying maturities, as of a specific date. For example, a yield curve for US Treasury instruments is a plot of yields to maturity for US Treasury bond issues with varying maturities as of the close of business on a particular date. Similarly, a plot of yields to maturity for AA-rated industrial bonds with various maturities is a yield curve for that class of instruments.
Refer to Exhibit 13.3. The curve in the graphs of the various yields to maturity illustrates what is called the term structure of interest rates. In the left panel of Exhibit 13.3, the yield to maturity on the instrument or class of instruments increases with maturity, whereas it declines with maturity in the right panel.

The slope, or shape, of the yield curve at a point in time has decision implications for those managing the short-term investment portfolio. Since short-term interest rates are typically lower than long-term rates, an upward-sloping yield curve is referred to as a normal yield curve. The liquidity preference theory of the term structure of interest rates holds that investors demand a yield premium in compensation for the lower liquidity that is associated with a longer maturity. Thus, long-term rates are normally higher than short-term rates.
A downward-sloping yield curve is referred to as an inverted yield curve. In this case, investors are shifting their preferences to long-term securities (or conversely, issuers are shifting their preferences to short-term borrowing). This increased demand for long-term securities causes their prices to increase and long-term yields to decline, thus pushing down the long-term end of the curve and causing an inversion. An inverted yield curve is typically a sign that the market is expecting a recession in the near future and is investing in longer-term securities to attempt to lock in interest rates or avoid any reduced interest rate that may occur in the short run. It is also a sign of low expectations with regards to future inflation, as expectations of high inflation would automatically increase the yields required on long-term securities (to offset the expected inflation) and create a normal, upward-sloping yield curve. An inverted yield curve may occur as the result of Federal Open Market Committee (FOMC) open market operations in the United States. If the US Federal Reserve (the Fed) is attempting to raise interest rates, and the target rate is a short-term interest rate, short-term rates will tend to increase before the actions affect longer-term interest rates. This may result in a downward-sloping yield curve until long-term rates increase.
The tax status of an investment has a direct effect on the investment yield. Tax-exempt securities, such as US T-bills,17 provide a lower pretax yield than taxable securities of similar maturity and default risk because of their tax advantage. When comparing taxable and tax-exempt instruments, the tax-exempt yield should be converted to a taxable equivalent to allow proper comparison. The tax-exempt yield can be converted to a taxable equivalent yield as follows:

For example, assume a treasury professional is choosing between a taxable security with a 1.50% yield and a tax-exempt security with a 1.20% yield. Both securities have similar risk and maturity. The firm’s marginal income tax rate is 21%. In this case, the tax-exempt security has a taxable equivalent yield of 1.52%, calculated as follows:

Another approach for comparing these securities is to compute the after-tax yield on the taxable security, which can then be compared directly to the tax-exempt instrument. The calculation is as follows:
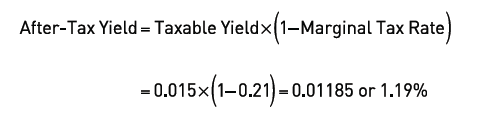
Both approaches indicate that the tax-exempt security should be chosen because it has a higher taxable equivalent yield (1.52% versus 1.50%) and a higher effective after-tax yield (1.20% versus 1.19%) than the taxable security.
This section provides examples that illustrate the calculations used to determine the yield on short-term investments. In general, a short-term investment yield is a function of the:
- Cash flows received from the investment
- Amount paid for the investment
- Maturity or holding period
One of the most basic types of yield is the holding period yield. The holding period yield is the return earned by an investor during the period in which the investment is held. Thus, a holding period yield can be calculated over investment periods (e.g., daily, weekly, monthly). A general formula for the holding period yield is:

As an example, assume that a $100,000 T-bill currently sells for $98,800 and matures in 90 days. The holding period yield is calculated as:

Two yields that are commonly quoted for short-term investments include the money market yield (MMY) and the bond equivalent yield (BEY). In essence, both yields annualize the holding period yield. The key difference in the determination of these yields is the number of days used in the calculations. This is known as the day count convention.
Calculations of investment returns are usually based on the number of days an instrument is held, and day count conventions determine the appropriate number of days to use in a particular calculation. For consistency and comparability purposes, treasury professionals should comply with the appropriate convention, keeping in mind that the appropriate convention may vary by instrument, country, or market.
When annualizing a yield, day count conventions define a year as having either 360 or 365 days. The use of a 360-day year has its roots in historical convention. The year was treated as consisting of 12 months, each with 30 days. Rate quotes and interest payments on most money market instruments are still computed using a 360-day year. An investor’s effective annual yield is computed using a 365-day year. The decision to use 360 versus 365 days in a year18 is a standard convention based upon historical practice and is usually not left to the user’s discretion.
When calculating yield for investments of less than a year, day count conventions also apply. For investments held for less than a month, investment calculations are always based on the actual number of days the instrument is held (known as the actual basis). When an investment is held for more than a month, each whole month may also be calculated on an actual basis (e.g., May has 31 days) or all months may be assumed to have 30 days (e.g., February and May both have 30 days).
The appropriate day count conventions for the yields discussed in this section indicate that the MMY is based on a 360-day year, while the BEY is based on a 365-day year.
The equations for the MMY and the BEY appear below:

The higher yield on the BEY is logical because there are more 90-day periods in a 365-day year than there are in a 360-day year. That is, it takes the investor a smaller proportion of the year to earn $1,200 in a 365-day year than it does in a 360-day year, so the annualized yield over a 365-day year will be higher.
Note that an investor can quickly convert from an MMY to a BEY by multiplying the MMY by the term (365÷360). Further, the BEY can be converted to an MMY by multiplying the BEY by the term (360÷365). This conversion works because the only difference in the MMY and BEY equations is the assumed days in a year (i.e., 360 versus 365). This short-cut approach is illustrated below using the previous example:

Another important concept related to short-term investment yields is the dollar discount. A security’s dollar discount refers to the difference between its par value (i.e., the amount received by the investor at maturity) and the purchase price. The dollar discount is important in this context because many money market securities do not pay interest and instead sell at a discount from par value (e.g., T-bills, commercial paper, and banker’s acceptances). These are referred to as discounted instruments. In the preceding example, the dollar discount is calculated as:

A concept related to the dollar discount is the discount rate, which is defined as the dollar discount divided by the par value and then annualized using a 360-day year. The following example illustrates the calculation of the discount rate:

Note that the MMY and BEY will always exceed the discount rate because the holding period yield is calculated using the purchase price, which is less than par value, whereas the discount rate calculation uses par value.
Dealers buy and sell T-bills in a secondary market and typically utilize a bid-ask quote framework. The ask quote is the discount at which the dealer will sell the T-bill, while the bid quote is the discount at which the dealer will purchase the T-bill. Both the bid and the ask quotes are based on a 360-day year because they are given in terms of a discount.
In addition to the bid and ask discounts, the ask yield is provided. The ask yield is the yield to an investor purchasing a T-bill at the ask discount. This yield is calculated on a 365-day year basis (i.e., it is quoted as a BEY). Sample quotes and calculations based on a March 13 purchase date are as follows:19
| Maturity Date | Days to Maturity | Bid Discount | Ask Discount | Ask Yield |
|---|---|---|---|---|
| (%) | (%) | (%) | ||
| April 18 | 36 | 0.075 | 0.065 | 0.066 |
| April 25 | 43 | 0.075 | 0.035 | 0.035 |
| May 2 | 50 | 0.070 | 0.035 | 0.066 |
| May 9 | 57 | 0.055 | 0.050 | 0.051 |
As an example, the purchase price an investor would pay for a $1,000,000 T-bill maturing on April 18 is based on the April 18 ask discount. The dollar discount and purchase price can be calculated by rearranging the discount rate and dollar discount calculations above, respectively, as shown here:

If the investor sold the T-bill, then the sale price paid to the investor by the dealer would be based on the April 18 bid discount of 0.075%:

The ask yield or BEY to the investor is determined as follows:

16 This discussion is primarily from the perspective of a US investor, to illustrate the effects of tax status, but investors outside of the United States may also have access to tax-advantaged investments, depending on local tax codes.
17 The tax exemption on US T-bills is only for state and local tax.
18 In some cases, 366 days is used in leap years.
19 This is the format typically used for T-bill quotations in the financial press.